All about Weather Station Model
What is the Weather Station Model?
A station model is a symbolic representation of the weather at a specific reporting station. The station model was designed by meteorologists to find a large number of weather variables in a small area on weather maps. Users can study patterns in air pressure, temperature, wind, cloud cover, and precipitation using detailed maps.
Temperature, dew point, wind, cloud cover, air pressure, pressure tendency, and precipitation are among the important weather parameters depicted in the plot.
How to read a Weather Station Model?
A weather map and map reading come with a variety of symbols and colors. The symbols on the weather map have a specific purpose that is to convey lots of information quickly without using words. Weather symbols are the language of weather, similar to how equations are the language of math. This makes it simple for anyone looking at a weather map. This article will teach you how to discern the meanings of the most popular weather station symbols.
What are the common symbols?
WEATHER
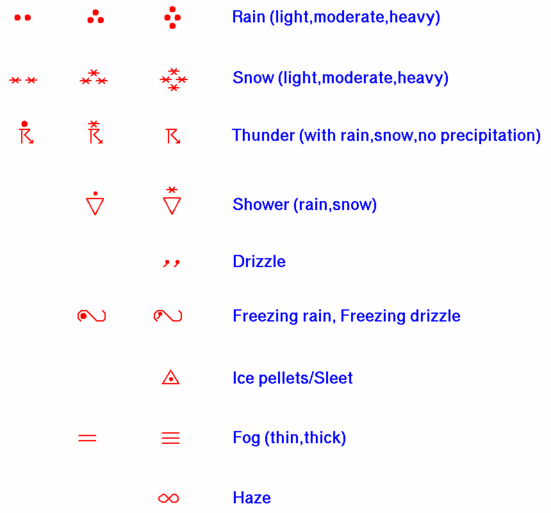
If there is precipitation or a condition that causes reduced visibility at the time of observation, a weather symbol is drawn. The most popular weather symbols are shown below:
Image credits National Weather Service
WIND
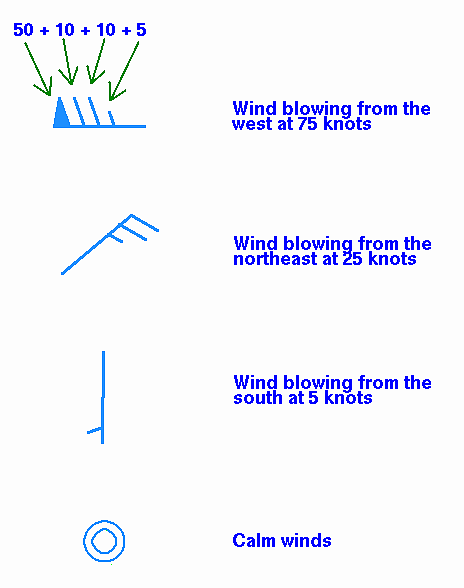
The wind is plotted in 5 knots (kt) increments, with the symbol’s outer end pointing in the direction the wind is blowing. The total number of flags, lines, and half-lines, each with the following individual values, is used to calculate the wind speed:
50 kts. flag
10 kts line
5 kts half-line
The wind is quiet if all that is represented over the station is a circle with no wind sign. Here are a few examples of wind symbols:

Image credits National Weather Service
PRESSURE
The pressure at sea is displayed in tenths of millibars (mb), however, the first digit or two are always omitted. In front of the three numerals, there will always be a 9 or 10, whichever brings the number closer to 1000. For example, the number 107 is actually 1010.7 megabytes. Because 1010.7 is closer to 1000 than 910.7, a ten is added to the front. For those unfamiliar with millibars, 30 in-HG is 1015.9 mb.
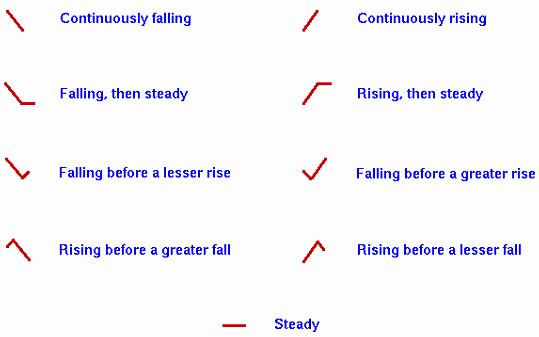
The pressure trend is represented by symbols that represent changes in the last three hours. The symbols for the pressure trend are as follows. A number appears next to the trend in some station graphs. The number reflects how much the pressure has risen or reduced during the last three hours in this situation.
Pressure Trends-

Image credits National Weather Service
SKY COVER
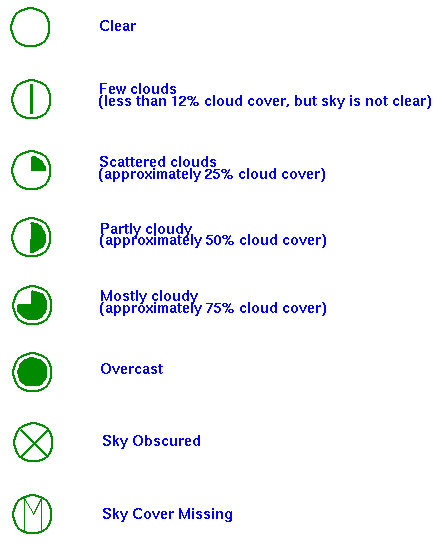
The location of the observation is indicated by the center circle, but the symbol itself also specifies the type of sky cover present at the time of the observation. The symbol is filled based on the amount of cloud cover expected in the sky. Here are a few examples of popular representations.

Image credits National Weather Service
Conclusion
This was simply a quick rundown of weather symbols. I hope you like this blog and learned something new. On the website the weather station, we have investigated, compared, and examined all of the many types of weather stations available on the market. You can learn more about the weather stations and their capabilities by visiting our website. You will be better equipped to read the weather map in the future after reading this article.
You can take a quick tour of our website to learn more about weather stations, their reviews, the best ones, how they work, and, finally, which one is the best investment for you.
Reference:-
https://www.wpc.ncep.noaa.gov/html/stationplot.shtml


Comments
Post a Comment